Graphing - Part II
Prepared for Gina. L
Questions: Please fully identify and sketch the following functions.
Function A : y = 2(x+2)2
Function B : y = 2x3 − 8x2 − 14x + 20
Function C : y = x3
Step 1 - Domain and Range (we had cover this in pervious lecture)
Function A: y = 2(x+2)2
Domain (−∞, ∞)
Range [0, ∞)
Function B: y = 2x3 − 8x2 − 14x + 20
Domain (−∞, ∞)
Range (−∞, ∞)
Function C: y = x3
Domain (−∞, ∞)
Range (−∞, ∞)
Step 2 - Even / Odd function (we had cover this in pervious lecture)
Function A: y = 2(x+2)2
y(x) = 2(x+2)2
= 2(x2 + 2x + 4)
y(−x) = 2((−x)+2)2
= 2(−x+2)2
= 2(x2 − 2x + 4)
y(x) = 2(x2 + 2x + 4) ≠ 2(x2 − 2x + 4) = y(−x)
y(x) = 2(x2 + 2x + 4) ≠ −2(x2 − 2x + 4) = −y(−x)
Therefore, function A, y = 2(x+2)2 is not even/odd function, its neither.
Function B: y = 2x3 − 8x2 − 14x + 20
y(x) = 2x3 − 8x2 − 14x + 20
y(−x) =2(−x)3 − 8(−x)2 − 14(−x) + 20
= −2x3 − 8x2 + 14x + 20
y(x) = 2x3 − 8x2 − 14x + 20 ≠ −2x3 − 8x2 + 14x + 20 = y(−x)
y(x) = 2x3 − 8x2 − 14x + 20 ≠ 2x3 + 8x2 − 14x − 20 = −y(−x)
Therefore, function B, y = 2x3 − 8x2 − 14x + 20 is not even/odd function, its neither.
Function C: y = x3
y(x) = x3
y(−x) = (−x)3
= −x3
y(x) = x3 = −(−x3) = −y(−x)
Therefore, function C, y = x3 is an odd function.
Step 3. Y-Intercept Point
To find y - intercept point of any function, we have to set x = 0, and get the y value.
Remember, in the case of function, we can only have ONE y-intercept point (one input, one output result)
Function A: y = 2(x+2)2
set x = 0,
we get y = 2(0+2)2
y = 2(2)
y = 8
Therefore, the y-int point for function A is (0, 8)
Function B: y = 2x3 − 8x2 − 14 x + 20
set x = 0,
we get y = 2(0)3 − 8(0)2 − 14(0) + 20
y = 2(0) − 8(0) − 14(0) + 20
y = 20
Therefore, the y-int point for function B is (0, 20)
Function C: y = x3
set x = 0
we get y = (0)3
y = 0
Therefore, the y-int point for function C is (0, 0)
Step 4 . Zeros (X - Intercept Points)
To find x - intercept points, we set y = 0,
notice, we can have zero, one or more than one zeros in a function (same output, could come from many different inputs)
Function A: y = 2(x+2)2
set y = 0,
we get 0 = 2(x+2)2
0 = (x+2)2
0 = (x+2)
x = −2
Therefore, the zeros (x-int point) for function A is (−2, 0)
Function B: y = 2 x3 − 8x2 − 14 x + 20
set y = 0,
we get 0 = 2x3 − 8x2 − 14 x + 20
since we cannot go further on factor, we can try long division to factor it,
plug into x = 1, 2, 3,.. so on to test if y = 0 (find at least one zero on the function).
start from x = 1
y = 2(1)3 − 8(1)2 − 14(1) + 20
= 2 − 8 − 14 + 20
= 2 − 22 + 20
= 0 (Yes, we find the zero!!)
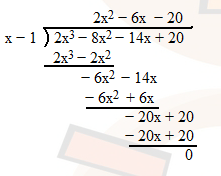
so at x = 1, there exist a zero, so we can said that (x − 1) is one of the factor of y = 2x3 − 8x2 − 14 x + 20.
by long division method, we write the following...
we get 2x2 − 6x − 20, now go back to our factor part left above,
y = 2 x3 − 8x2 − 14 x + 20
= (x − 1)(2x2 − 6 x − 20)
= 2(x − 1)(x2 − 3x − 10)
= 2(x − 1)(x − 5)(x + 2)
set y = 0
0 = 2(x − 1)( x − 5)(x + 2)
x = 1 or x = 5 or x = −2
Therefore, the zeros (x-int points) for function B are (−2, 0), (1, 0) and (5, 0).
Function C: y = x3
set y = 0
we get 0 = x3
x = 0
Therefore, the zeros (x-int points) for function C is (0, 0)
Step 5 . Positive or Negative
Function A: y = 2(x+2)2
draw a table to help us find out where is the output (y) of function become positive or negative.
the key point is used the zeros (x-int) as a border, from step 4, we get x-int point as (−2, 0)
| Input (x) |
x < −2 (try x = −3) |
x > −2 (try x = 0) |
| y = 2(x+2)2 |
y = 2(−3+2)2 = 2(1) |
y = 2(0+2)2 = 2(4) |
| Output (y) |
+ Positive |
+ Positive |
Function B: y = 2 x3 − 8x2 − 14 x + 20
from step 4, we get x-int points as (−2, 0), (1, 0) and (5, 0)
| Input (x) |
x < −2 (try x = −3) |
−2 < x < 1 (try x = 0) |
1 < x < 5 (try x = 2) |
x > 5 (try x =6) |
| y = 2 x3 − 8x2 − 14 x + 20 |
y = 2(−3)3 − 8(−3)2 − 14(−3) + 20 = −54 − 32 + 42 + 20 = − 24 |
y = 2(0)3 − 8(0)2 − 14(0) + 20 = 0 − 0 − 0 + 20 = 20 |
y = 2(2)3 − 8(2)2 − 14(2) + 20 = 16 − 32 − 28 + 20 = − 24 |
y = 2(6)3 − 8(6)2 − 14(6) + 20 = 432 − 288 − 84 + 20 = 80 |
| Output (y) |
− Negative |
+ Positive |
− Negative |
+ Positive |
Function C: y = x3
from step 4, we get x-int point as (0, 0)
| Input (x) |
x < 0 (try x = −1) |
x > 0 (try x = 1) |
| y = x3 |
y = (−1)3 = −1 |
y = (1)3 = 1 |
| Output (y) |
− Negative |
+ Positive |
Step 6. Asymptotes
Vertical Asymptotes, Horizontal Asymptotes, Oblique Asymptotes
We will cover it later.
Step 7. 1st Order Derivative (y')
Critical Points and Increasing or Decreasing
Function A: y = 2(x+2)2
y' = dy/dx = d/dx 2(x+2)2
= 4(x + 2)
set dy/dx = 0
0 = 4(x + 2)
x = − 2
when x = − 2, y = 0
the critical point is (− 2, 0)
| Input (x) |
x < −2 (try x = −3) |
x > −2 (try x = 0) |
| y' = 4(x + 2) |
y' = 4(−3 + 2) = −4 |
y' = 4(0 + 2) = 4 |
| Slope (y') |
− Decreasing |
+ Increasing |
Function B: y = 2 x3 − 8x2 − 14 x + 20
y' = dy/dx = d/dx 2x3 − 8x2 − 14 x + 20
= 6x2 − 16x − 14
set dy/dx = 0
0 = 6x2 − 16x − 14
0 = 2(3x2 − 8x − 7)
0 = 3 x2 − 8x − 7
again, we cannot factor it, however, this time, we don't need to go to long division, we can use quadratic equation to solve it.
a = 3, b = − 8, c = − 7
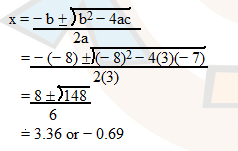
when x = 3.36, y = 2(3.36)3 − 8(3.36)2 −14(3.36) + 20 = −94.77
and when x = −0.69, y = 2(−0.69)3 − 8(−0.69)2 − 14(−0.69) + 20 = 25.19
the critical point are (3.36, −94.77) and (−0.69, 25.19).
| Input (x) |
x < −0.69 (try x = −1) |
−0.69< x < 3.36 (try x = 0) |
x > 3.36 (try x = 4) |
| y' = 6x2 − 16x − 14 |
y' = 6(−1)2 − 16(−1) − 14 = 8 |
y' = 6(0)2 − 16(0) − 14 = − 14 |
y' = 6(4)2 − 16(4) − 14 = 18 |
| Slope (y') |
+ Increasing |
− Decreasing |
+ Increasing |
Function C: y = x3
y' = dy/dx = d/dx x3
= 3x2
set dy/dx = 0
0 = 3x2
x = 0
when x = 0, y = 0
the critical point is (0, 0)
| Input (x) |
x < 0 (try x = −1) |
x > 0 (try x = 1) |
| y' = 3x2 |
y' = 3(−1)2 = 3 |
y' = 3(1)2 = 3 |
| Slope (y') |
+ Increasing |
+ Increasing |
Step 8. 2nd Order Derivative (y")
Min and Max points, Curve Up or Curve Down, Point of Inflection and Cusp
Function A: y = 2(x+2)2
Step 8.1 - find 2nd order derivative
y" = d2y/dx2 = d/dx y'
= d/dx 4(x + 2)
= 4
Step 8.2 find min/max points
Notice the critical points (step-7) we get, they may be Min / Max point,
in order to identify them, we MUST test them by 2nd order derivative, from step-7 we get the critical point as (− 2, 0),
sub x = − 2 into y", we get
y" = 4
Since y" = 4 > 0 (positive), it is a MIN point,
therefore we get one MIN point at (− 2, 0).
Step 8.3 Curve Up or Curve Down
y"=4 > 0 for all along the function.
| Input (x) |
x |
| y" = 4 |
y" = 4 |
| Change of Slope (y") |
+ Curve Up |
P.S. For easier way to remember curve up or down and Min or MAX, you may think like this,
if y" >0 = positive number, think it as a HAPPY face (curve UP), and there is a MIN point (minimum of anger).

if y" < 0 = negative number, think it as a SAD face (curve DOWN), and there is a MAX point (maximum of anger).

Step 8.4 Point of Inflection and Cusp
Since y"≠ 0, there are NO point of inflection or cusp.
Function B: y = 2x3 − 8x2 − 14x + 20
y" = d2y/dx2 = d/dx y'
= d/dx 3x2 − 8x − 7
= 6x − 8
the critical points from step 7 are (3.36, −94.77) and (−0.69, 25.19), sub them into y".
when x = 3.36
y" = 6 (3.36) − 8 = 12.16 > 0 (positive), so (3.36, −94.77) is a MIN point.
when x = −0.69
y" = 6( −0.69) − 8 = −12.14 < 0 (negative), so (−0.69, 25.19) is a MAX point.
then, we set y" = 0
0 = 6x − 8
x = 8/6
= 1.333...
y = 2(1.33)3 − 8(1.33)2 − 14(1.33) + 20
= − 8.06
| Input (x) |
x < 1.333... (try x = 0) |
x > 1.333... (try x = 2) |
| y" = 6x − 8 |
y" = 6(0) − 8 = − 8 |
y" = 6(2) − 8 = 4 |
| Change of Slope (y") |
− Curve Down |
+ Curve Up |
At x = 8/6 = 1.333... , it might be a point of inflection or cusp, in order to identify it,
we have to check if it's increasing or decreasing, now by combine the two table, we can easier to see the relationship between curve up/down and increasing/ decreasing.
| Input (x) |
x < −0.69 (try x = −1) |
−0.69< x < 1.33.. (try x = 0) |
1.33..< x < 3.36 (try x = 2) |
x > 3.36 (try x = 4) |
| y' = 6x2 − 16x − 14 |
y' = 6(−1)2 − 16(−1) − 14 = 8 |
y' = 6(0)2 − 16(0) − 14 = − 14 |
y' = 6(2)2 − 16(2) − 14 = −22 |
y' = 6(4)2 − 16(4) − 14 = 18 |
| Slope (y') |
+ Increasing |
− Decreasing |
− Decreasing |
+ Increasing |
| y" = 6x − 8 |
y" = 6( −1) − 8 = − 14 |
y" = 6(0) − 8 = − 8 |
y" = 6(2) − 8 = 4 |
y" = 6(4) − 8 = 16 |
| Change of Slope (y") |
− Curve Down |
− Curve Down |
+ Curve Up |
+ Curve Up |
curve up/down and increasing/ decreasing.
Take a look at the column are shaded, before x = 1.33 it decreasing, after x = 1.33 it still decreasing, however,
it curve down before x=1.33 but curve up after x=1.33, since the sing of y" change, point (1.33, − 8.06) is a point of inflection.
P.S. Notice if the sign of y" does not change, it is cusp point
Point of Inflection
Decreasing -> Decreasing
Curve Down -> Curve Up
Cusp
Decreasing -> Increasing
Curve Down -> Curve Down
Function C: y = x3
y" =d2y/dx2 = d/dx y'
= d/dx 3x2
= 6x
the critical points from step 7 is (0, 0), sub x = 0 into y".
y" = 6 (0) = 0, we cannot tell it is MIN or MAX (we have four possibility, it could be MIN, MAX, Point of Inflection or Cusp)
To identify which one is the correct one, we have to check is the function curve up or curve down.
set y" = 0
0 = 6x
x = 0
| Input (x) |
x < 0... (try x = −1) |
x > 0... (try x = 1) |
| y" = 6x |
y" = 6(−1) = − 6 |
y" = 6(1) = 6 |
| Change of Slope (y") |
− Curve Down |
+ Curve Up |
combine the two table, we can easier to see the relationship between curve up/down and increasing/ decreasing.
| Input (x) |
x < 0 (try x = −1) |
x > 0 (try x = 1) |
| y' = 6x2 |
y' = 6(−1)2 = 6 |
y' = 6(1)2 = 6 |
| Slope (y') |
+ Increasing |
+ Increasing |
| y" = 6x |
y" = 6(−1) = − 6 |
y" = 6(1) = 6 |
| Change of Slope (y") |
− Curve Down |
+ Curve Up |
Take a look before x = 0 it is increasing, after x = 0 it still increasing, however,
it curve down before x=0 but curve up after x=0, since the sing of y" change, point (0,0) is a point of inflection.
Step 9. Sketching
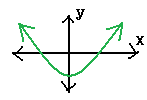
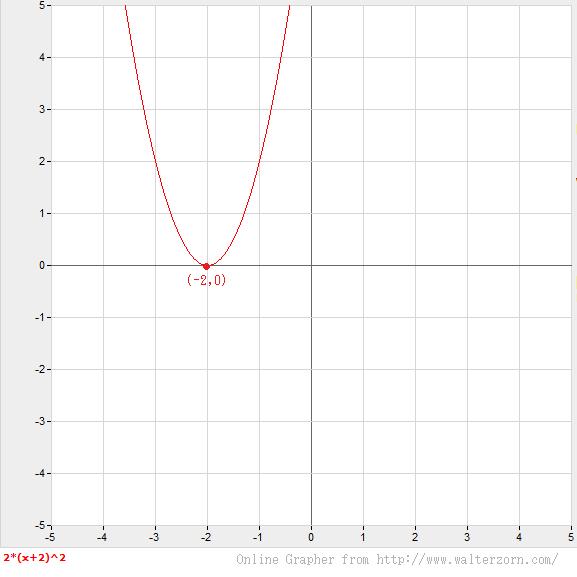
Function A : y = 2(x+2)2
| Domain | (−∞, ∞) |
| Range | [0, ∞) |
| Even / Odd | neither |
| y-int point | (0, 8) |
| zeros (x-int point) | (−2, 0) |
| critical point is | (− 2, 0) |
| local min/max | local min at (− 2, 0) |
| curve | curve up (−∞, ∞) |
As well as the positive/negative region, increasing/decreasing region's information, you shall able to sketch Function.A easily.
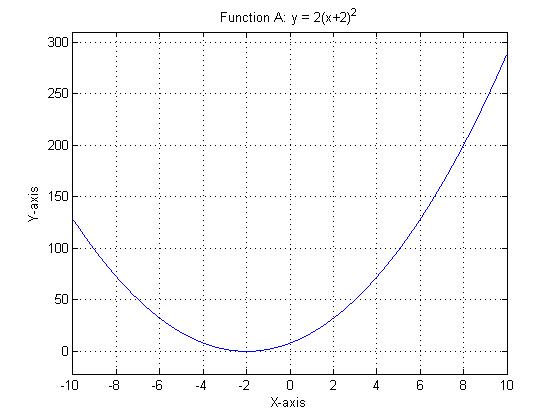
Additionally, you may wish to check the result by using a powerful math tool - MATLAB (http://www.mathworks.com)
|
% Function A y = 2(x+2)^2 plots, simply MATLAB script written by KK.
ezplot ('2*(x+2)^2',[-10,10]);
% The domain for x set between -10 to 10 |
it generates the following output.
Repeat the same procedures as we had done above, now, try to sketch function B and C.
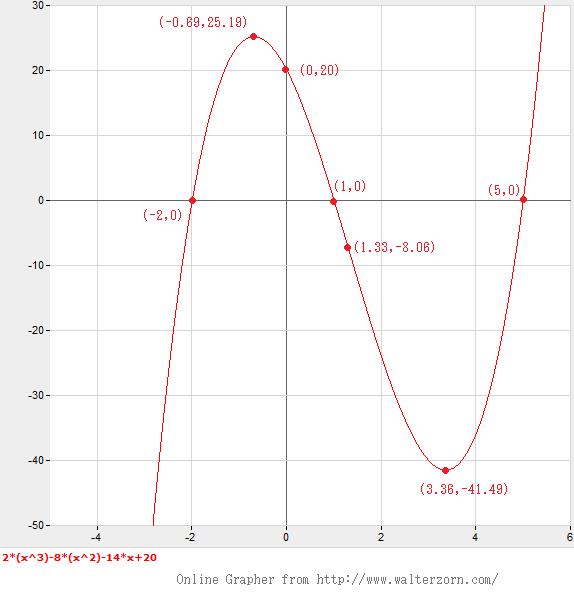
Function B : y = 2x3 − 8x2 − 14x + 20
|
% Function B 2(x^3) − 8(x^2) − 14x + 20 plots, simply MATLAB script written by KK.
ezplot ('2*(x^3) -
8*(x^2) - 14*x + 20',[-4,6]); %
The domain for x set between -4 to 6 |
and with image tool "Data Cursor" in MATLAB, we can trace the function's local max, min on the plots (its just for checking purpose).
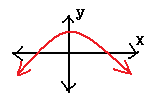
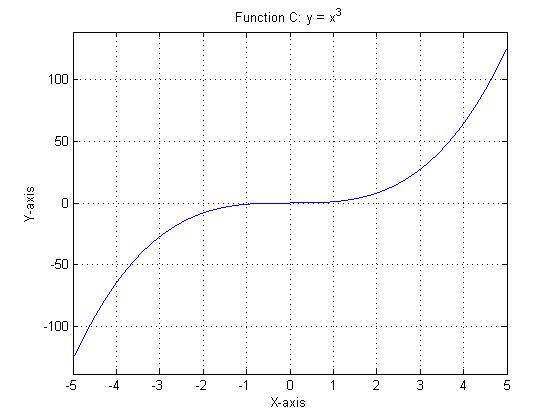
Function C: y = x3
By online graphing tool.
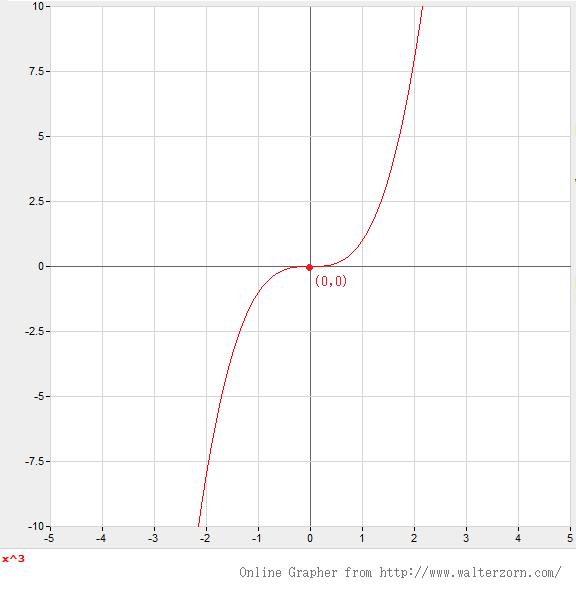
By MATLAB
All the functions are now fully sketched.
Good luck and see you later ~ lol
Written by Kevin Tang (Mar 28, 2010)
Copyright 2010 - KEVKEVWORLD.NET